Best Digital Advertising Platforms in 2026: Complete Comparison Guide
Digital advertising has become the lifeblood of modern business growth. With global digital ad spend projected to exceed $780 billion in 2026, choosing the right advertising platform can make the difference between explosive growth and wasted budget.
But here’s the challenge: There are dozens of platforms competing for your advertising dollars, each claiming to deliver the best ROI. Google Ads promises intent-driven leads. Meta brags about unmatched targeting precision. LinkedIn touts B2B conversion superiority. TikTok evangelizes viral reach potential.
So which platform actually deserves your budget?
This comprehensive guide breaks down the top digital advertising platforms in 2026, comparing costs, targeting capabilities, ad formats, and ROI potential across industries. Whether you’re a startup with a $5,000 monthly budget or an enterprise spending six figures, you’ll discover exactly which platforms align with your business goals.
What You’ll Learn:
- Detailed breakdown of 10 major advertising platforms
- Real-world cost benchmarks and ROI data
- Platform-specific strengths and weaknesses
- How to choose the right platform for your business
- Budget allocation strategies across multiple platforms
- Emerging platforms worth watching
Let’s dive in.
Table of Contents
- How to Evaluate Digital Advertising Platforms
- Google Ads: The Intent-Driven Powerhouse
- Meta Ads (Facebook & Instagram): Precision Targeting Leader
- LinkedIn Ads: B2B Marketing Dominance
- TikTok Ads: The Viral Growth Engine
- Microsoft Advertising: The Underrated Alternative
- YouTube Ads: Video Advertising Excellence
- Twitter/X Ads: Real-Time Engagement
- Pinterest Ads: Visual Discovery Platform
- Snapchat Ads: Gen Z Engagement
- Amazon Ads: E-commerce Advertising Power
- Platform Comparison Tables
- How to Choose the Right Platform
- Budget Allocation Strategies
- Emerging Platforms to Watch
- Frequently Asked Questions
How to Evaluate Digital Advertising Platforms
Before comparing individual platforms, let’s establish the criteria that actually matter when evaluating where to invest your advertising budget.
1. Audience Reach and Demographics
What to Consider:
- Total active users on the platform
- User demographics (age, gender, income, education)
- Geographic distribution
- User intent and behavior patterns
Why It Matters: You can have the perfect ad creative and targeting strategy, but if your ideal customers aren’t on the platform, your campaigns will fail. A B2B software company targeting C-suite executives will find better ROI on LinkedIn than TikTok, while a Gen Z fashion brand should prioritize Instagram and TikTok over LinkedIn.
2. Targeting Capabilities
What to Consider:
- Demographic targeting options
- Interest and behavior targeting
- Lookalike audience capabilities
- Retargeting functionality
- Intent-based targeting (search behavior)
- Account-based marketing features (B2B)
Why It Matters: Targeting precision directly impacts your cost per acquisition. Platforms with granular targeting options let you reach high-intent prospects while excluding tire-kickers, reducing wasted ad spend.
3. Ad Formats and Creative Flexibility
What to Consider:
- Available ad formats (video, image, carousel, stories, etc.)
- Creative specifications and requirements
- Interactive ad options
- Native advertising integration
- Dynamic ad capabilities
Why It Matters: Different products and services demand different storytelling approaches. E-commerce brands thrive with visual carousel ads, while B2B services often need longer-form video content to explain complex solutions.
4. Cost Structure and ROI Potential
What to Consider:
- Average cost per click (CPC)
- Average cost per thousand impressions (CPM)
- Cost per acquisition (CPA) benchmarks
- Minimum budget requirements
- Bidding options and flexibility
Why It Matters: A platform with higher CPCs can still deliver better ROI if conversion rates are superior. Understanding cost structures helps you allocate budgets effectively and set realistic performance expectations.
5. Platform Maturity and Algorithm Sophistication
What to Consider:
- Machine learning and AI optimization capabilities
- Campaign automation features
- Testing and experimentation tools
- Reporting and analytics depth
- Integration ecosystem
Why It Matters: Mature platforms with sophisticated algorithms can optimize campaigns more effectively, reducing the manual work required to achieve results. Newer platforms may offer cheaper CPCs but require more hands-on management.
6. Business Model Alignment
What to Consider:
- B2C vs B2B effectiveness
- E-commerce integration
- Lead generation capabilities
- Brand awareness vs direct response
- Sales cycle compatibility
Why It Matters: Not all platforms excel at all business models. TikTok dominates impulse-purchase e-commerce but struggles with complex B2B sales. LinkedIn converts enterprise software leads but rarely drives viral consumer product sales.
Now that we’ve established evaluation criteria, let’s examine each major platform in detail.
Google Ads: The Intent-Driven Powerhouse
Best For: Businesses targeting customers actively searching for solutions
Starting Budget: $1,000-$5,000/month
Primary Strength: Intent-driven targeting via search behavior
Primary Weakness: Increasingly competitive and expensive in popular niches
Platform Overview
Google Ads remains the dominant force in digital advertising, controlling roughly 28% of global digital ad spend in 2026. With over 8.5 billion searches processed daily, Google offers unparalleled access to prospects actively seeking solutions.
The platform has evolved significantly since its AdWords days, now offering:
- Search Network (text ads on Google search results)
- Display Network (banner ads across 2+ million websites)
- Shopping Ads (product listings with images and prices)
- YouTube Ads (video advertising, covered separately)
- Discovery Ads (visual ads across Gmail, Discover, and YouTube feed)
- Performance Max (AI-driven campaigns across all Google properties)
Audience and Reach
Scale:
- 8.5 billion daily searches
- 90%+ global search engine market share
- Display Network reaches 90% of internet users worldwide
Demographics:
- Broad across all age groups, skewing slightly older (35-54 most active)
- Balanced gender distribution
- All income levels, education backgrounds, and geographies
User Intent: Google’s unique advantage is search intent. When someone searches “best freight broker in Texas” or “enterprise CRM software,” they’re signaling active buying intent. This makes Google Ads particularly powerful for bottom-of-funnel conversions.
Targeting Capabilities
Search Campaigns:
- Keyword targeting (exact match, phrase match, broad match)
- Geographic targeting (country, state, city, radius)
- Demographic targeting (age, gender, household income)
- Device targeting (mobile, desktop, tablet)
- Audience targeting (in-market, affinity, custom intent)
Display/Discovery Campaigns:
- Contextual targeting (topics, placements, keywords)
- Audience targeting (remarketing, similar audiences, custom audiences)
- Demographic targeting
- Combined targeting (layering multiple signals)
Advanced Features:
- Customer Match (upload email lists for targeting)
- Similar Audiences (lookalikes based on converters)
- In-Market Audiences (users actively researching specific products)
Ad Formats
Search Ads:
- Responsive Search Ads (automated headline/description testing)
- Call-only ads (mobile click-to-call)
- Dynamic Search Ads (automatically generated from website content)
Display Ads:
- Responsive Display Ads (automatically sized for all placements)
- Image ads (uploaded creative)
- Gmail ads (expandable ads in Gmail promotions tab)
Shopping Ads:
- Product Shopping Ads (individual product listings)
- Showcase Shopping Ads (grouped product displays)
- Local inventory ads (drive in-store traffic)
Performance Max:
- Fully automated campaigns across all Google properties
- AI-driven creative optimization
- Goal-based bidding (leads, sales, store visits)
Cost Structure (2026 Benchmarks)
Search Ads:
- Average CPC: $2.69 (across all industries)
- Competitive industries: $6-50+ per click
- Legal: $45-80
- Insurance: $18-35
- Finance: $12-25
- B2B Software: $8-18
- E-commerce: $1-3
Display Ads:
- Average CPM: $3.12
- Average CPC: $0.63
- Lower cost but typically lower conversion rates
Shopping Ads:
- Average CPC: $0.66
- High conversion rates (intent-driven)
- ROAS typically 300-600% for e-commerce
Performance Max:
- CPA varies widely based on goals
- Typically 15-30% better CPA than manual campaigns once optimized
Strengths
1. Unmatched Intent Signals When someone searches “buy enterprise CRM software,” they’re not casually browsing—they’re actively looking to purchase. This intent data produces conversion rates 3-5x higher than social media platforms for many businesses.
2. Massive Scale Google processes 8.5 billion searches daily. Even in niche markets, you’ll find search volume. A B2B company targeting “industrial wastewater treatment” may only get 500 monthly searches, but those 500 searchers are highly qualified.
3. Sophisticated Automation Google’s AI has become remarkably effective at optimizing campaigns. Performance Max campaigns can outperform manually optimized campaigns by 20-30% in many cases, though they sacrifice control.
4. Comprehensive Ecosystem Integration with Google Analytics 4, YouTube, Gmail, and the Display Network creates full-funnel advertising capabilities from awareness to conversion.
5. Transparency and Control Unlike some platforms, Google provides extensive performance data, auction insights, and granular control over budgets, bids, and targeting.
Weaknesses
1. Rising Costs Competition has driven CPCs up 15-20% annually in many industries. What cost $5 per click in 2023 now costs $6-7. Small businesses with limited budgets struggle to compete.
2. Click Fraud and Invalid Traffic Studies suggest 10-20% of clicks may be fraudulent or accidental. While Google refunds invalid clicks, detection isn’t perfect.
3. Declining Organic Real Estate Google now shows 4+ ads above organic results on commercial queries, pushing organic listings below the fold. This increases reliance on paid advertising.
4. Privacy Changes Impact Display Cookie deprecation and privacy regulations have reduced Display Network targeting precision, making it less effective than previous years.
5. Performance Max Black Box While effective, Performance Max campaigns provide limited insight into what’s actually working, making optimization feel like guesswork.
Best Use Cases
Ideal For:
- Local service businesses (plumbers, dentists, lawyers)
- E-commerce stores with product catalogs
- B2B companies targeting specific search terms
- Businesses with established brand recognition
- High-ticket products/services that justify high CPCs
Not Ideal For:
- Brand-new businesses with no market awareness
- Products people don’t actively search for
- Very low-margin products that can’t support $2+ CPCs
- Businesses requiring extensive customer education before purchase
Budget Recommendations
Starting Budget:
- $1,000-2,000/month minimum for Search campaigns
- $500-1,000/month minimum for Display campaigns
- $2,000-5,000/month minimum for Shopping campaigns (e-commerce)
Scaling:
- Most accounts hit efficiency peaks between $10K-50K/month
- Beyond $50K/month, consider expanding to additional platforms
- Maintain 3-6 month budget reserves (Google Ads requires consistency)
ROI Expectations (Industry Benchmarks)
Average Across Industries:
- Conversion Rate: 3.75% (search), 0.77% (display)
- Cost Per Conversion: $56 (search), $120 (display)
- Average ROAS: 200-400%
Top Performing Industries:
- E-commerce: 400-800% ROAS
- Lead Generation (B2B): 300-600% ROAS
- Local Services: 500-1000% ROAS
Bottom Line: Google Ads remains the gold standard for intent-driven advertising. If your customers are searching for solutions, Google should be your first platform investment. However, rising costs demand sophisticated optimization and may price out businesses in highly competitive niches.
Meta Ads (Facebook & Instagram): Precision Targeting Leader
Best For: Businesses targeting specific demographics, interests, and behaviors
Starting Budget: $500-$2,000/month
Primary Strength: Unmatched audience targeting precision
Primary Weakness: Attribution challenges post-iOS 14
Platform Overview
Meta’s advertising ecosystem spans Facebook, Instagram, Messenger, and the Audience Network, reaching 3.98 billion monthly active users across its family of apps. Despite privacy headwinds and increased competition from TikTok, Meta remains the second-largest digital advertising platform globally, commanding roughly 18% of digital ad spend in 2026.
What sets Meta apart isn’t just reach—it’s targeting sophistication. The platform knows more about user behavior, interests, and intent than any competitor (except Google). This data powers targeting capabilities that can reach:
- New parents interested in organic baby products living in Austin
- CFOs at manufacturing companies with 100-500 employees
- Women aged 25-34 who recently got engaged and like luxury travel
Audience and Reach
Facebook:
- 2.96 billion monthly active users
- Primary demographics: 25-54 years old
- Broad across all income levels and geographies
- Skews slightly older than Instagram
Instagram:
- 2.4 billion monthly active users
- Primary demographics: 18-34 years old
- Higher income/education demographics
- Strong visual and e-commerce focus
Combined Reach:
- 3.98 billion combined MAUs (some overlap)
- Available in 190+ countries
- Average user spends 33 minutes daily on Facebook, 30 minutes on Instagram
Targeting Capabilities
Meta’s targeting arsenal remains the most comprehensive in digital advertising:
Core Audiences (Demographics):
- Age (13-65+)
- Gender
- Location (country, state, city, zip code, radius)
- Language
- Education level
- Job title
- Employer
- Relationship status
- Life events (recently moved, new job, newly engaged)
Interest Targeting:
- 1,000+ interest categories
- Behaviors (purchase behavior, device usage, travel patterns)
- Connections (people who like your page, friends of fans)
Custom Audiences:
- Website visitors (via Meta Pixel)
- Customer lists (email/phone number uploads)
- App activity
- Offline activity
- Engagement (video viewers, Instagram profile visitors, lead form openers)
Lookalike Audiences:
- Mirror characteristics of your best customers
- 1-10% similarity (1% = most similar)
- Can create lookalikes from any Custom Audience
Advantage+ Audience:
- AI-driven broad targeting
- Meta’s algorithm finds converters automatically
- Effective when combined with good creative
Ad Formats
Feed Ads:
- Single image
- Single video
- Carousel (2-10 scrollable images/videos)
- Collection ads (product catalog showcases)
Stories Ads:
- Full-screen vertical format (9:16)
- 15-second video or static image
- Available on Facebook and Instagram Stories
Reels Ads:
- Vertical video format
- Appears between organic Reels
- 9:16 aspect ratio, up to 60 seconds
In-Stream Video Ads:
- Pre-roll, mid-roll, post-roll
- Appears during video content
- 5-15 second non-skippable or longer skippable formats
Messenger Ads:
- Sponsored messages
- Click-to-Messenger ads
- Conversation ads
Lead Ads:
- In-app lead forms (pre-filled from profile data)
- Reduces friction for mobile lead generation
- Integrates with CRMs
Cost Structure (2026 Benchmarks)
Average Costs Across All Industries:
- CPC: $0.94
- CPM: $14.90
- Cost Per Lead: $58
- Cost Per App Install: $2.07
Industry-Specific Costs:
| Industry | Avg CPC | Avg CPM | Avg CPL |
| E-commerce | $0.70 | $12.50 | $35 |
| B2B Services | $1.85 | $22.40 | $95 |
| Finance | $2.15 | $28.30 | $125 |
| Healthcare | $1.32 | $18.75 | $68 |
| Real Estate | $1.55 | $19.20 | $72 |
| Education | $1.10 | $15.80 | $55 |
| SaaS | $1.90 | $23.50 | $105 |
Important Note: Costs vary dramatically based on targeting specificity, creative quality, and offer strength. Well-optimized campaigns can achieve 40-60% lower CPAs than industry averages.
Strengths
1. Targeting Precision No other platform offers Meta’s depth of behavioral and demographic data. You can target “marketing managers at tech companies who recently visited your website and watched 75% of your video ad.” This precision reduces wasted spend.
2. Visual Storytelling Excellence Meta’s feed-based, visual-first format excels at brand storytelling. Carousel ads can showcase product features, video ads can demonstrate solutions, and Stories create immersive experiences.
3. Retargeting Power Meta’s retargeting capabilities are unmatched. You can create custom audiences based on:
- Website visitors who viewed specific pages
- Video viewers who watched 25%, 50%, 75%, or 95%
- Instagram profile visitors
- Lead form openers who didn’t complete
4. Creative Testing Infrastructure Meta’s dynamic creative and A/B testing tools make it easy to test multiple hooks, images, headlines, and CTAs simultaneously, accelerating learning.
5. Full-Funnel Capabilities From awareness (video views, reach) to consideration (traffic, engagement) to conversion (leads, purchases), Meta supports every funnel stage.
Weaknesses
1. iOS 14+ Attribution Challenges Apple’s App Tracking Transparency (ATT) framework has devastated Meta’s attribution accuracy. Studies suggest Meta now tracks only 50-60% of conversions compared to pre-iOS 14. This makes:
- ROAS calculations less accurate
- Optimization less effective
- Retargeting audiences smaller
2. Ad Fatigue and Creative Burnout Meta users see 4-6 ads per scroll session. Creative fatigue sets in quickly—CTR can drop 40-50% after 3-7 days of exposure. This demands constant creative refreshes.
3. Declining Organic Reach Organic Facebook page posts now reach less than 2% of followers. This forces businesses to pay for reach that was previously free, increasing long-term advertising dependency.
4. Platform Saturation With 10 million advertisers competing for attention, CPMs have risen 35% since 2022. Ad fatigue is real, and users are developing “banner blindness” to obvious ads.
5. Policy Enforcement Inconsistency Meta’s ad review process uses AI that frequently rejects compliant ads while approving policy-violating ones. Appeals can take days, disrupting campaign launches.
Best Use Cases
Ideal For:
- E-commerce brands (especially visual products)
- Local businesses targeting specific zip codes
- B2C products with broad appeal
- Lead generation for services
- App installs and engagement
- Event promotion
- Content creators building audiences
Not Ideal For:
- Niche B2B products with tiny TAMs
- Products requiring extensive research before purchase
- High-complexity services needing lengthy education
- Industries with restrictive ad policies (crypto, supplements, etc.)
Budget Recommendations
Starting Budget:
- $500-1,000/month minimum for testing
- $2,000-5,000/month for meaningful data
- $10,000+/month for consistent lead/sales volume
Budget Allocation:
- 60% to proven winners
- 25% to testing new creatives/audiences
- 15% to retargeting
Creative Budget: Budget $500-2,000/month for new creative production. Meta success demands constant creative refreshes—plan for 15-25 new ads per month.
ROI Expectations (Industry Benchmarks)
E-commerce:
- Average ROAS: 250-400%
- Top performers: 600-1000%
- Conversion rate: 1.5-3%
Lead Generation:
- Cost per lead: $35-150 (varies by industry)
- Lead-to-customer: 15-30%
- Customer acquisition cost: $120-500
App Installs:
- Cost per install: $1-5
- Install-to-active user: 20-40%
Bottom Line: Meta Ads remains essential for most businesses despite attribution challenges. The platform’s targeting precision, visual storytelling capabilities, and massive reach make it irreplaceable for e-commerce, local businesses, and consumer brands. However, iOS privacy changes demand sophisticated tracking setups (Conversions API, server-side tracking) and realistic attribution expectations.
LinkedIn Ads: B2B Marketing Dominance
Best For: B2B companies targeting decision-makers and professionals
Starting Budget: $5,000-$10,000/month
Primary Strength: Access to 950M professionals with verified job data
Primary Weakness: Highest cost per click among major platforms
Platform Overview
LinkedIn has transformed from a professional networking site into a B2B marketing powerhouse, commanding premium ad prices justified by unmatched professional targeting. With 950 million members (310 million monthly active users), LinkedIn offers access to decision-makers that other platforms can’t match.
Here’s why LinkedIn dominates B2B advertising: User intent and data quality. When someone lists “VP of Supply Chain at Fortune 500 Manufacturing Company” on LinkedIn, that data is accurate—their career depends on it. Compare this to Facebook, where job titles are optional and often outdated.
This verified professional data enables targeting like:
- CMOs at SaaS companies with 50-200 employees
- Cybersecurity professionals at financial services firms
- Operations directors in healthcare with purchasing authority
Audience and Reach
Scale:
- 950 million total members
- 310 million monthly active users
- 59% of users are 25-34 years old
- Available in 200 countries/territories
Professional Demographics:
- 90 million senior-level influencers
- 63 million decision-makers
- 10 million C-level executives
- Skews higher income ($75K+ annually)
- 51% have bachelor’s degrees or higher
Industry Representation:
- Technology: 22%
- Financial Services: 14%
- Healthcare: 10%
- Manufacturing: 8%
- Professional Services: 18%
Targeting Capabilities
LinkedIn’s targeting sophistication for B2B is unrivaled:
Company-Level Targeting:
- Company name (target specific companies)
- Company size (1-10 to 10,000+ employees)
- Industry (200+ industry categories)
- Company growth rate (fast-growing, stable, declining)
- Company revenue
- Company connections (employees, followers)
Job-Level Targeting:
- Job title (exact titles or categories)
- Job function (Engineering, Finance, HR, Sales, etc.)
- Job seniority (Entry, Manager, Director, VP, C-Suite)
- Years of experience
- Skills (10,000+ skills in database)
Education:
- Degree (Associate, Bachelor’s, Master’s, PhD)
- Field of study
- Schools attended
Interests and Groups:
- LinkedIn Group membership
- Interests
- Traits (e.g., “frequent travelers,” “job seekers”)
Audience Expansion:
- Matched Audiences (email lists, website visitors, account lists)
- Lookalike Audiences
- Predictive Audiences (AI finds similar converters)
Account-Based Marketing (ABM):
- Upload target account lists
- Target employees at specific companies
- Measure engagement at account level
Ad Formats
Sponsored Content:
- Single image ads
- Video ads
- Carousel ads (2-10 swipeable cards)
- Document ads (upload PDFs, presentations)
- Event ads (promote virtual/in-person events)
Sponsored Messaging:
- Message ads (direct InMail)
- Conversation ads (choose-your-path messaging)
Text Ads:
- Small image + headline
- Pay-per-click or pay-per-impression
- Desktop only
Dynamic Ads:
- Follower ads (grow page followers)
- Spotlight ads (personalized ads featuring member’s profile photo)
- Content ads (promote content downloads)
Lead Gen Forms:
- Pre-filled forms using LinkedIn profile data
- Mobile-optimized, frictionless
- Integrates with CRMs (HubSpot, Salesforce, Marketo)
Cost Structure (2026 Benchmarks)
LinkedIn is the most expensive major ad platform, but costs reflect audience quality:
Average Costs:
- CPC: $5.26
- CPM: $33.80
- Cost Per Lead: $75-150 (varies widely)
- Cost Per Download: $50-100
By Campaign Objective:
- Website Visits: $5-8 CPC
- Lead Generation: $75-150 CPL
- Engagement: $2-4 per engagement
- Video Views: $0.02-0.04 per view
Industry Variations:
| Industry | Avg CPC | Avg CPL |
| Enterprise Software | $8-12 | $150-250 |
| Financial Services | $6-10 | $100-175 |
| Consulting | $5-8 | $80-140 |
| Manufacturing | $4-7 | $70-120 |
| Marketing Services | $7-11 | $120-200 |
Important Note: While expensive, LinkedIn leads often convert at 2-3x the rate of other platforms for B2B, making the higher CPL justifiable.
Strengths
1. Unmatched Professional Targeting No platform comes close to LinkedIn’s professional data accuracy. Target “Directors of IT at healthcare organizations with 500-1,000 employees in the Northeast.” This precision eliminates waste.
2. High-Quality B2B Leads LinkedIn users are in “professional mode,” not entertainment mode. They expect business content and are more receptive to B2B offers. Lead quality consistently exceeds Facebook/Google for B2B.
3. Decision-Maker Access 63 million decision-makers are active on LinkedIn. For enterprise software, consulting, or B2B services, this is the only platform where you can reliably reach C-suite executives.
4. Account-Based Marketing (ABM) LinkedIn pioneered ABM advertising, letting you upload target account lists and reach employees at those specific companies. Perfect for enterprise sales targeting Fortune 1000.
5. Professional Content Environment Your ads appear alongside industry articles, thought leadership, and career content—not cat videos and political arguments. This context improves brand perception.
Weaknesses
1. Prohibitively Expensive for SMBs At $5+ CPC and $100+ CPL, small businesses with $2,000/month budgets struggle to generate enough volume for meaningful testing. LinkedIn demands deep pockets.
2. Lower Active Usage Users spend 7 minutes daily on LinkedIn vs. 33 minutes on Facebook. Less time on platform means fewer impression opportunities and higher competition for limited attention.
3. Limited Creative Formats Compared to Meta or TikTok, LinkedIn’s ad formats feel constrained. No Stories, limited video engagement, and a professional environment that discourages creative experimentation.
4. Smaller Audiences Highly specific targeting (e.g., “CMOs at SaaS companies in Austin”) might only reach 500-2,000 people. You’ll exhaust audiences quickly, driving up frequency and costs.
5. Longer Sales Cycles B2B purchases take 3-12 months. You’ll wait months to measure true ROAS, making short-term optimization challenging.
Best Use Cases
Ideal For:
- B2B SaaS and enterprise software
- Professional services (consulting, accounting, legal)
- Recruitment and talent acquisition
- Financial services targeting businesses
- Industrial manufacturing and B2B equipment
- Executive education and MBA programs
- B2B events and conferences
Not Ideal For:
- B2C consumer products
- Small businesses with <$5,000/month ad budgets
- Products with short sales cycles
- Mass-market offerings
- Entertainment or lifestyle brands
Budget Recommendations
Minimum Viable Budget:
- $5,000-10,000/month for meaningful testing
- $15,000-25,000/month for consistent lead flow
- $50,000+/month for enterprise ABM programs
Budget Allocation:
- 70% to Lead Gen Forms (highest conversion)
- 20% to Sponsored Content (awareness/engagement)
- 10% to testing new audiences/formats
Campaign Structure:
- Start with 5-7 targeted campaigns
- Each campaign targets specific persona (role, industry, company size)
- Budget $1,000-2,000 per campaign monthly
ROI Expectations (Industry Benchmarks)
Lead Generation:
- CPL: $75-150
- Lead-to-MQL: 40-60% (higher quality than other platforms)
- MQL-to-SQL: 30-50%
- SQL-to-Customer: 15-30%
- Customer Acquisition Cost: $500-5,000 (varies by deal size)
For High-Ticket B2B ($50K+ deals):
- If average deal size is $75K
- If CAC is $2,500 via LinkedIn
- If close rate is 20%
- Effective cost per customer: $12,500
- ROI: 500% over customer lifetime
Bottom Line: LinkedIn Ads is expensive but irreplaceable for B2B companies targeting professionals and decision-makers. If your product/service sells to businesses for $10K+, LinkedIn’s lead quality justifies the premium pricing. However, small businesses and consumer brands should look elsewhere.
<a name=”tiktok-ads”></a>
TikTok Ads: The Viral Growth Engine
Best For: Consumer brands targeting Gen Z and Millennials with visual products
Starting Budget: $500-$1,500/month
Primary Strength: Viral potential and lowest CPMs among major platforms
Primary Weakness: Limited B2B effectiveness and older demographic reach
Platform Overview
TikTok has exploded from trendy newcomer to advertising powerhouse in just five years. With 1.7 billion monthly active users spending an average of 95 minutes daily on the platform, TikTok offers unprecedented engagement rates and viral potential.
What makes TikTok unique isn’t just its audience—it’s the algorithm. TikTok’s “For You Page” (FYP) algorithm is remarkably effective at surfacing content to interested users, even from accounts with zero followers. A brand-new advertiser can achieve viral reach that would cost hundreds of thousands on other platforms.
The platform’s short-form video format (15-60 seconds) and creator-driven culture demand authentic, entertaining content over polished corporate ads. Brands that adapt to TikTok’s native style see explosive growth; those that repurpose Instagram ads fail.
Audience and Reach
Scale:
- 1.7 billion monthly active users globally
- Available in 150+ countries
- 95 minutes average daily usage (highest among social platforms)
Demographics:
- 60% of users are 18-34 years old
- 43% are Gen Z (18-24)
- Increasingly diverse age groups (35-44 growing fastest)
- 57% female, 43% male
- Higher engagement than other platforms
Geographic Strength:
- Dominant in US, UK, Southeast Asia
- Growing rapidly in Latin America and Europe
- Banned or restricted in India, parts of Middle East
Purchase Behavior:
- 67% of users say TikTok inspired them to shop
- Average TikTok user makes 2.1 purchases monthly influenced by platform
- Strong impulse-purchase behavior
Targeting Capabilities
TikTok’s targeting is less sophisticated than Meta but improving rapidly:
Demographics:
- Age (13-17, 18-24, 25-34, 35-44, 45-54, 55+)
- Gender
- Location (country, state, city, DMA, zip code)
- Language
Interests:
- 20+ interest categories (Beauty, Fashion, Food, Gaming, Sports, etc.)
- Hashtag targeting
- Creator targeting (reach fans of specific creators)
Behaviors:
- Video interactions (liked, shared, commented on videos)
- Hashtag interactions
- Creator interactions
Device:
- Operating system (iOS/Android)
- Device model
- Carrier
- Connection type (WiFi, 4G, 5G)
Custom Audiences:
- Website visitors (via TikTok Pixel)
- App activity
- Customer file (email/phone upload)
- Engagement audiences (video viewers, profile visitors)
Lookalike Audiences:
- Mirror characteristics of custom audiences
- Automatic, Balanced, or Narrow similarity
Spark Ads:
- Boost organic TikTok posts (yours or creators’)
- Leverage existing engagement and authenticity
Ad Formats
In-Feed Ads:
- Appear in users’ For You Page feed
- 9:16 vertical video, 5-60 seconds
- Skippable after 5 seconds
- Can include CTA buttons (Shop Now, Learn More, Download)
TopView Ads:
- First thing users see when opening TikTok
- Up to 60 seconds
- Full-screen takeover
- Premium placement, premium price ($50K+ for major markets)
Branded Hashtag Challenges:
- Create a branded challenge with custom hashtag
- Encourage user-generated content
- Banner placement on Discover page
- High cost ($150K+ for 6-day campaign)
Branded Effects:
- Custom filters, stickers, and AR effects
- Users create content using your branded effects
- High production cost, high engagement
Collection Ads:
- Showcases multiple products
- Instant Galleries for product browsing
- Strong for e-commerce
Spark Ads:
- Boost organic content (your posts or creators’)
- Maintains authentic feel
- Leverages existing engagement
Shopping Ads:
- Product links within videos
- Live shopping integration
- TikTok Shop integration (in select markets)
Cost Structure (2026 Benchmarks)
TikTok offers some of the lowest costs among major platforms:
Average Costs:
- CPM: $4.50-10.00 (significantly lower than Meta/LinkedIn)
- CPC: $0.50-1.00
- CPV (Cost Per View): $0.01-0.02
- Cost Per App Install: $1.50-3.00
By Objective:
- Reach: $4-6 CPM
- Traffic: $0.50-1.00 CPC
- App Installs: $1.50-3.00 per install
- Conversions: $15-60 CPL (varies by industry)
Premium Placements:
- TopView: $50,000-100,000 per day
- Branded Hashtag Challenge: $150,000 for 6 days
- Branded Effects: $100,000-200,000 development + media
Important Notes:
- Minimum campaign budget: $50/day
- Minimum ad group budget: $20/day
- Lower costs reflect younger, less affluent audience
Strengths
1. Viral Potential TikTok’s algorithm can make unknown brands go viral overnight. A single creative that resonates can generate millions of views organically, multiplying paid reach exponentially.
2. Lowest CPMs Among Major Platforms At $4-10 CPM vs. $15-34 on Meta/LinkedIn, TikTok offers incredible reach efficiency. You can achieve 3-5x more impressions per dollar.
3. Highest Engagement Rates TikTok users actively engage (like, comment, share) at rates 3-5x higher than Instagram or Facebook. Average engagement rate: 5-9% vs. 1-2% on other platforms.
4. Authentic Creator Partnerships TikTok’s creator economy makes influencer partnerships seamless. Spark Ads let you amplify creator content that performs organically.
5. Trend-Riding Opportunities TikTok’s trend-driven culture creates opportunities for brands to piggyback on viral sounds, dances, and memes for increased relevance.
Weaknesses
1. Limited B2B Effectiveness Users are on TikTok for entertainment, not business research. B2B products, professional services, and high-consideration purchases struggle to convert.
2. Creative Production Demands TikTok requires constant fresh video content. Unlike static image ads, video production is resource-intensive and expensive. Plan for 10-20 new videos monthly.
3. Younger, Lower-Income Demographics If your target customer is 35+ or in B2B, TikTok’s user base skews too young. Additionally, purchasing power is lower than platforms with older demographics.
4. Brand Safety Concerns TikTok’s algorithm occasionally places ads next to controversial or inappropriate content. Brand safety controls exist but aren’t foolproof.
5. Tracking and Attribution Challenges TikTok Pixel tracking is less mature than Meta or Google. Attribution can be inconsistent, making ROAS measurement challenging.
6. Platform Uncertainty Ongoing regulatory scrutiny (potential US ban, data privacy concerns) creates uncertainty for long-term advertising commitments.
Best Use Cases
Ideal For:
- E-commerce brands with visual products (fashion, beauty, home goods)
- Direct-to-consumer (DTC) brands
- App downloads targeting Gen Z/Millennials
- Food and beverage brands
- Entertainment and media promotion
- Fitness and wellness products
- Gaming and technology accessories
Not Ideal For:
- B2B products and services
- Financial services and insurance
- Professional services (legal, accounting, consulting)
- Products targeting 45+ demographics
- High-consideration purchases requiring extensive research
Budget Recommendations
Starting Budget:
- $500-1,500/month for testing
- $3,000-7,000/month for consistent results
- $15,000+/month for scaling winners
Creative Budget:
- Budget $1,000-3,000/month for video production
- Consider creator partnerships ($500-5,000 per creator)
- Test UGC (user-generated content) style ads (often outperform polished content)
Campaign Structure:
- Start with 3-5 ad groups testing different creatives
- Budget $50-100/day per ad group initially
- Scale winners to $200-500/day
ROI Expectations (Industry Benchmarks)
E-commerce:
- Average ROAS: 150-300% (lower than Meta but improving)
- Conversion rate: 0.5-2%
- Best for impulse purchases under $100
App Installs:
- Cost per install: $1.50-3.00
- Install-to-active user: 25-45%
- Strong for gaming, entertainment, lifestyle apps
Lead Generation:
- CPL: $15-60
- Lead quality: Lower than LinkedIn/Google but improving
- Best for low-commitment offers (free trials, downloads)
Bottom Line: TikTok Ads is the platform for consumer brands targeting younger demographics with visual, impulse-purchase products. The combination of low CPMs, high engagement, and viral potential creates opportunities for explosive growth. However, B2B companies, older demographics, and high-consideration purchases should invest elsewhere.
Microsoft Advertising: The Underrated Alternative
Best For: Businesses looking for lower CPCs on search advertising
Starting Budget: $500-$1,500/month
Primary Strength: 30-50% lower CPCs than Google with similar intent signals
Primary Weakness: Significantly lower search volume (10-15% of Google’s)
Platform Overview
Microsoft Advertising (formerly Bing Ads) is the perennial underdog in search advertising, controlling just 10-12% of US search market share. However, smart advertisers recognize Microsoft Ads as a high-efficiency channel offering Google-like intent signals at fraction of the cost.
Microsoft’s search ecosystem includes:
- Bing.com (the primary search engine)
- Yahoo search (powered by Bing)
- DuckDuckGo (privacy-focused, Bing-powered)
- AOL search
- Microsoft Edge browser integrations
- Windows 10/11 search integrations
While search volume is lower, user quality is often higher. Bing users skew older, more affluent, and higher-educated—demographics with greater purchasing power.
Audience and Reach
Search Volume:
- 1.1 billion searches per day globally
- 12% of US desktop search market
- 36% of US desktop search market (including Yahoo, AOL)
Demographics:
- Average age: 35-54 (older than Google)
- 45% have household income $75K+
- 40% have bachelor’s degree or higher
- 56% male, 44% female
Device Mix:
- 65% desktop (higher than Google’s 45%)
- 35% mobile
Geographic Strength:
- Strong in United States (12% market share)
- Moderate in UK, Canada, Australia
- Weak internationally
Targeting Capabilities
Microsoft Ads offers parity with Google Ads in most areas:
Search Network:
- Keyword targeting (exact, phrase, broad match)
- Negative keywords
- Geographic targeting
- Demographic targeting (age, gender)
- Device targeting
- Dayparting (schedule ads by hour/day)
- Audience targeting (remarketing, custom audiences, in-market)
Audience Network:
- Similar to Google Display
- Reaches Microsoft properties (MSN, Outlook.com, Microsoft Edge)
- Third-party publisher sites
LinkedIn Profile Targeting (Unique to Microsoft):
- Target by company, industry, job function
- Leverage LinkedIn’s professional data
- Available for search and audience campaigns
Ad Formats
Search Ads:
- Responsive Search Ads (same as Google)
- Expanded Text Ads (still supported, unlike Google)
- Dynamic Search Ads
Shopping Ads:
- Product Ads (via Microsoft Merchant Center)
- Microsoft Shopping Campaigns
Display/Audience Ads:
- Image ads
- Responsive ads
- Native ads
App Install Ads:
- Drive iOS and Android app downloads
Multimedia Ads:
- Video ads on MSN and partner sites
Cost Structure (2026 Benchmarks)
Microsoft Ads’ primary appeal is cost efficiency:
Average Costs:
- CPC: $1.54 (vs. $2.69 on Google – 43% lower)
- CPM: $2.10 (on Audience Network)
- Conversion costs: 30-50% lower than Google
Industry Comparisons:
| Industry | Google CPC | Microsoft CPC | Savings |
| Legal | $52 | $31 | 40% |
| Insurance | $24 | $14 | 42% |
| Finance | $16 | $9 | 44% |
| B2B Software | $12 | $7 | 42% |
| E-commerce | $1.80 | $1.10 | 39% |
Conversion Rates:
- Generally similar to Google (within 10-15%)
- Some advertisers report higher conversion rates due to less commercial intent (more research-oriented users)
Strengths
1. Lower Cost Per Click 30-50% lower CPCs than Google Ads mean you can acquire more traffic and conversions for the same budget. For small businesses, this difference is significant.
2. Less Competition Fewer advertisers mean less auction pressure. In niches dominated by Google Ads bidding wars, Microsoft offers breathing room.
3. LinkedIn Profile Targeting Unique ability to layer LinkedIn professional data onto search campaigns. Target “IT Directors searching for ‘cybersecurity software'” for powerful B2B reach.
4. Higher-Income Demographics Bing users have 25% higher average household income than Google users. For luxury products, financial services, and premium offerings, this matters.
5. Easier Import from Google Ads Microsoft’s import tool lets you clone Google Ads campaigns in minutes, making it effortless to expand your search advertising footprint.
6. Better Customer Support Microsoft provides more accessible support than Google, including dedicated reps for accounts spending $1,000+/month.
Weaknesses
1. Lower Search Volume 1.1 billion daily searches vs. Google’s 8.5 billion. You’ll reach 10-15% of the audience, which may not provide enough scale for large advertisers.
2. Desktop-Heavy Traffic 65% desktop vs. 35% mobile. For mobile-first businesses, this skew is problematic.
3. Limited International Reach Microsoft Ads is primarily a US/UK/Canada/Australia platform. Weak in Asia, Latin America, Africa.
4. Fewer Features and Integrations Google Ads innovations (Performance Max, broad match evolution, attribution modeling) often take 1-2 years to reach Microsoft. Feature parity exists but on delay.
5. Lower Brand Search Volume Users searching for known brands typically use Google. Microsoft captures more generic, research-oriented searches.
Best Use Cases
Ideal For:
- Businesses already advertising on Google Ads (easy expansion)
- B2B companies targeting professionals
- Local service businesses
- E-commerce stores seeking lower acquisition costs
- High-ticket products targeting affluent demographics
- Industries with expensive Google CPCs
Not Ideal For:
- Mobile-first businesses
- International campaigns outside US/UK/Canada/Australia
- Brands requiring massive search volume
- Highly visual products (search format is text-heavy)
Budget Recommendations
Starting Budget:
- $500-1,500/month for testing
- Mirror 10-20% of your Google Ads budget
- $2,000-5,000/month for established campaigns
Import Strategy:
- Import Google Ads campaigns initially
- Monitor for 2-4 weeks
- Optimize based on Microsoft-specific performance
Allocation:
- 80-90% of search budget to Google Ads
- 10-20% to Microsoft Ads
- Adjust based on relative performance
ROI Expectations (Industry Benchmarks)
Compared to Google Ads:
- Similar conversion rates (within 10-15%)
- 30-50% lower CPA due to lower CPCs
- 10-15% of Google’s search volume
- Often higher ROAS due to cost efficiency
Typical Performance:
- E-commerce ROAS: 300-500%
- Lead gen CPL: 30-50% lower than Google
- B2B conversion rates: Often 10-20% higher (affluent, professional demographics)
Bottom Line: Microsoft Advertising is the low-hanging fruit of search advertising. If you’re already running Google Ads, importing campaigns to Microsoft takes 30 minutes and typically delivers 30-50% lower CPAs with similar conversion quality. The platform won’t replace Google Ads, but it’s an essential complement for cost-efficient search advertising expansion.
YouTube Ads: Video Advertising Excellence
Best For: Brand awareness and video-driven storytelling
Starting Budget: $1,000-$3,000/month
Primary Strength: 2.7B users, video format, Google’s targeting
Primary Weakness: Lower direct response conversion rates
Key Points:
- Audience: 2.7B monthly users, broad demographics, 1 billion hours watched daily
- Formats: Skippable in-stream, non-skippable, bumper ads, discovery ads, shorts ads
- Costs: $0.10-0.30 CPV, $3-12 CPM
- Best For: Brand building, product demonstrations, tutorials, entertaining content
- ROI: Best for awareness metrics; conversion tracking challenging
<a name=”twitter-ads”></a>
Twitter/X Ads: Real-Time Engagement
Best For: Real-time marketing, news, and conversation-driven brands
Starting Budget: $500-$1,500/month
Primary Strength: Real-time conversation and trending topic targeting
Primary Weakness: Declining user base and advertiser concerns post-Musk acquisition
Key Points:
- Audience: 550M monthly users (down from 650M in 2022), skews news/politics/tech interested
- Formats: Promoted tweets, promoted accounts, promoted trends
- Costs: $0.50-2.00 CPC, $6.50 CPE
- Best For: News orgs, tech companies, event promotion, customer service
- Concerns: Advertiser exodus, brand safety issues, platform instability
Pinterest Ads: Visual Discovery Platform
Best For: E-commerce and lifestyle brands with visual products
Starting Budget: $500-$2,000/month
Primary Strength: High purchase intent (users actively planning purchases)
Primary Weakness: Narrow demographic (mostly women 25-54)
Key Points:
- Audience: 480M monthly users, 77% women, high purchase intent
- Formats: Promoted pins, shopping ads, carousel ads, video pins
- Costs: $0.10-1.50 CPC, $3-8 CPM
- Best For: Home decor, fashion, food, DIY, weddings, beauty
- ROI: 200-400% ROAS for e-commerce in relevant verticals
Snapchat Ads: Gen Z Engagement
Best For: Brands targeting 13-24 year olds
Starting Budget: $500-$1,500/month
Primary Strength: 75% of 13-24 year olds in US use platform
Primary Weakness: Limited targeting compared to Meta
Key Points:
- Audience: 750M monthly users, 48% are 15-25 years old
- Formats: Snap ads, story ads, collection ads, AR lenses
- Costs: $0.50-3.00 CPC, $3-8 CPM
- Best For: Mobile apps, fashion, beauty, entertainment, gaming
- ROI: Strong for app installs and Gen Z products
Amazon Ads: E-commerce Advertising Power
Best For: Product sellers on Amazon and e-commerce brands
Starting Budget: $1,000-$3,000/month
Primary Strength: Reach shoppers at the point of purchase
Primary Weakness: Only effective for products sold on Amazon
Key Points:
- Audience: 310M active customers, 200M Prime members, massive purchase intent
- Formats: Sponsored products, sponsored brands, sponsored display, DSP
- Costs: $0.50-3.00 CPC (highly variable by category)
- Best For: Amazon sellers, e-commerce brands, product launches
- ROI: 300-800% ROAS common for optimized campaigns
Platform Comparison Tables
Cost Comparison
| Platform | Avg CPC | Avg CPM | Avg CPL | Best For |
| Google Ads | $2.69 | – | $56 | Intent-driven search |
| Meta Ads | $0.94 | $14.90 | $58 | Demographic targeting |
| $5.26 | $33.80 | $75-150 | B2B professionals | |
| TikTok | $0.50-1.00 | $4.50-10 | $15-60 | Gen Z engagement |
| Microsoft | $1.54 | $2.10 | 30-50% lower | Cost-efficient search |
| YouTube | $0.10-0.30 CPV | $3-12 | Varies | Video awareness |
| Twitter/X | $0.50-2.00 | $6.50 CPE | $25-75 | Real-time marketing |
| $0.10-1.50 | $3-8 | $30-80 | Visual discovery | |
| Snapchat | $0.50-3.00 | $3-8 | $20-60 | Gen Z mobile |
| Amazon | $0.50-3.00 | – | N/A | E-commerce |
Audience Demographics
| Platform | Primary Age | Income | B2B or B2C | Purchase Intent |
| 25-54 | All | Both | Very High | |
| Meta | 25-54 (FB), 18-34 (IG) | All | B2C | Medium |
| 25-54 | High | B2B | High (B2B) | |
| TikTok | 18-34 | Low-Medium | B2C | Medium |
| Microsoft | 35-54 | High | Both | Very High |
| YouTube | 18-49 | All | Both | Low-Medium |
| Twitter/X | 25-44 | Medium-High | Both | Low |
| 25-54 | Medium-High | B2C | Very High | |
| Snapchat | 13-24 | Low | B2C | Medium |
| Amazon | 25-54 | All | B2C | Extremely High |
How to Choose the Right Platform for Your Business
Selecting advertising platforms isn’t about picking the “best” one—it’s about matching platform strengths to your business model, audience, and goals.
Step 1: Define Your Business Model
E-Commerce:
- Primary: Google Shopping + Meta (Instagram/Facebook)
- Secondary: Amazon (if selling there), Pinterest, TikTok
- Avoid: LinkedIn (unless B2B e-commerce)
B2B Services/Software:
- Primary: LinkedIn + Google Search
- Secondary: YouTube (for demos), Microsoft Ads
- Avoid: TikTok, Snapchat, Pinterest
Local Services:
- Primary: Google Search + Meta (Facebook)
- Secondary: Microsoft Ads
- Avoid: LinkedIn, TikTok (unless targeting young homeowners)
Consumer Apps:
- Primary: TikTok + Meta + Snapchat
- Secondary: Google App Campaigns, YouTube
- Avoid: LinkedIn
Content/Media:
- Primary: Meta + TikTok + YouTube
- Secondary: Twitter/X, Pinterest
- Avoid: LinkedIn (unless B2B media)
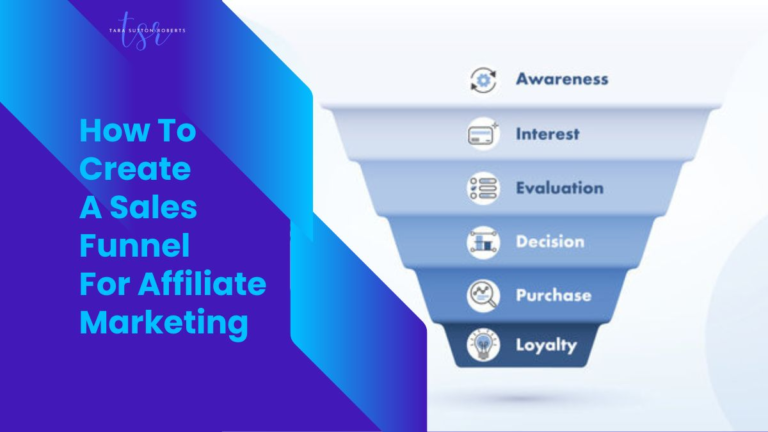
Step 2: Match Platform to Funnel Stage
Awareness (Top of Funnel):
- YouTube (video views)
- TikTok (viral reach)
- Meta (reach campaigns)
- Display (Google, Microsoft)
Consideration (Middle of Funnel):
- Meta (retargeting, engagement)
- YouTube (consideration campaigns)
- LinkedIn (content engagement)
Conversion (Bottom of Funnel):
- Google Search (intent-driven)
- Amazon (purchase-ready)
- Meta (conversion campaigns)
- LinkedIn (B2B lead gen)
Step 3: Consider Your Budget
$1,000-2,000/month:
- Choose 1-2 platforms maximum
- Recommended: Google Search OR Meta
- Avoid spreading thin across multiple platforms
$2,000-5,000/month:
- 2-3 platforms viable
- Recommended: Google + Meta OR LinkedIn + Google (B2B)
- Test secondary platforms with 20% of budget
$5,000-15,000/month:
- 3-4 platforms recommended
- Primary: 60% to best performer
- Secondary: 30% to strong performer
- Testing: 10% to new platforms
$15,000+/month:
- Multi-platform strategy essential
- Full-funnel coverage (awareness → conversion)
- Continuous testing and optimization
Step 4: Evaluate Your Creative Capabilities
Limited Creative Resources:
- Focus on text-based platforms: Google Search, Microsoft Ads
- Or use simple image ads on Meta
- Avoid: TikTok, YouTube (video production intensive)
Strong Visual Assets:
- Leverage: Meta, Pinterest, Instagram
- Consider: Display advertising
- Test: TikTok with UGC-style content
Video Production Capability:
- Prioritize: YouTube, TikTok
- Supplement: Meta video ads, LinkedIn video
- Maximize: Video across all platforms
Budget Allocation Strategies
The 70-20-10 Rule
Allocate your advertising budget:
- 70% to proven performers (platforms generating positive ROI)
- 20% to growth opportunities (platforms showing promise)
- 10% to testing (new platforms, experimental campaigns)
Example ($10,000/month total budget):
- $7,000 → Google Ads (proven winner, 5:1 ROAS)
- $2,000 → Meta Ads (growing, 3:1 ROAS)
- $1,000 → TikTok testing (exploring new audience)
Multi-Platform Integration Strategy
Phase 1: Foundation (Months 1-3)
- Launch primary platform (Google OR Meta)
- Establish baseline performance
- Build retargeting audiences
- Goal: Achieve positive ROI on one platform
Phase 2: Expansion (Months 4-6)
- Add secondary platform
- Implement cross-platform retargeting
- Test new audience segments
- Goal: Diversify traffic sources
Phase 3: Optimization (Months 7-12)
- Add tertiary platforms
- Implement full-funnel strategy
- Advanced attribution modeling
- Goal: Maximize overall ROAS across ecosystem
Industry-Specific Recommendations
E-Commerce:
- 50% Google Shopping
- 30% Meta (Instagram/Facebook)
- 10% Amazon Ads (if applicable)
- 10% Testing (Pinterest, TikTok)
B2B SaaS:
- 50% LinkedIn
- 30% Google Search
- 10% YouTube
- 10% Testing (Microsoft, Display)
Local Services:
- 60% Google Search
- 30% Meta (Facebook)
- 10% Microsoft Ads
Consumer Apps:
- 40% Meta
- 30% TikTok
- 20% Google App Campaigns
- 10% Testing (Snapchat)
Emerging Platforms to Watch in 2026
Reddit Ads
- 500M+ monthly users
- High-intent communities
- Lower CPCs than major platforms
- Best for: Tech products, gaming, niche communities
- Watch: Improving self-serve platform, better targeting
Threads (Meta)
- 150M+ monthly users (growing)
- Text-based, Twitter alternative
- Currently no ads (launching 2026)
- Watch: Meta’s track record with ad products
BeReal Ads
- 70M+ daily users (Gen Z)
- Authentic, unfiltered content
- Limited ad offerings currently
- Watch: Innovative ad formats matching platform ethos
Twitch Ads
- 140M monthly users
- Gaming and entertainment focus
- Video ads during streams
- Best for: Gaming, tech, youth brands
Frequently Asked Questions
Q: Should I advertise on multiple platforms simultaneously? A: Not initially. Master one platform with proven ROI before expanding. Exception: If you have $10K+/month budget, running Google + Meta simultaneously makes sense from day one.
Q: Which platform has the best ROI? A: It depends entirely on your business model. Google Search delivers the best ROI for intent-driven purchases. Meta excels for impulse buys. LinkedIn wins for B2B. There’s no universal winner.
Q: How long should I test a platform before deciding it doesn’t work? A: Minimum 30 days and $1,000-2,000 spend per platform. Some platforms (LinkedIn, Google Search) show results quickly. Others (TikTok, YouTube) require 60-90 days for algorithm learning.
Q: Can I run the same ads across all platforms? A: No. Each platform has unique formats, audience behaviors, and creative best practices. Ads must be adapted (or created natively) for each platform.
Q: What’s the minimum budget to start advertising? A: $500-1,000/month minimum for any single platform. Below this, you won’t generate enough data for meaningful optimization.
Q: Should small businesses advertise on LinkedIn despite high costs? A: Only if you’re B2B with deals $10K+. For small B2C businesses or low-ticket B2B, LinkedIn’s CPL is prohibitive.
Q: Is TikTok advertising worth it for B2B companies? A: Rarely. Unless your B2B product targets young decision-makers (think HR software, workplace tools for startups), TikTok underperforms for B2B.
Final Recommendations
If You Can Only Choose ONE Platform:
- E-commerce: Google Shopping Ads
- B2B Services: LinkedIn Ads
- Local Services: Google Search Ads
- Consumer Products (Visual): Meta Ads (Instagram)
- Apps: Meta Ads + Google App Campaigns (tie)
Best Platform Combinations:
- Small Budget ($1-5K/month): Google Search alone
- Medium Budget ($5-15K/month): Google + Meta
- Large Budget ($15-50K/month): Google + Meta + LinkedIn (B2B) OR Google + Meta + TikTok (B2C)
- Enterprise Budget ($50K+/month): Multi-platform full-funnel strategy
The Bottom Line:
Digital advertising success isn’t about finding the “best” platform—it’s about matching platform strengths to your business model, audience, and creative capabilities. Start with one platform, achieve profitability, then systematically expand your footprint.
Google dominates intent-driven search. Meta excels at demographic precision. LinkedIn owns B2B professional targeting. TikTok delivers viral reach to young consumers. Each platform has its place in a comprehensive strategy.
The biggest mistake isn’t choosing the wrong platform—it’s spreading budget too thin across too many platforms before mastering any single one.
Start focused. Test systematically. Scale strategically.

Hi I’m Tara! I’m a digital marketer who specializes in turning marketing budgets into measurable revenue. With over 15 years of experience managing campaigns for national, regional, and local clientele as well as “soloprenuers” for everything from the beverages industry to the banking industry, I’ve learned what actually drives conversions—and what’s just expensive noise. When not analyzing CAC ratios or optimizing funnels, you’ll find me breaking down the latest marketing tactics on my blog to help business owners stop guessing and start growing.